Meaning Graphs · dynamic UML · Meaning Cells · repository evidence

Dynamic, navigable, multi-layer UML for large codebases.

Meaning Graphs transform a repository into a navigable representation: source structure, semantic AST, SCIR, Meaning Cells, dependency hierarchies, flow, and generated UML views. It is not generic code search. It is a way to see what a software system means and where the evidence lives.

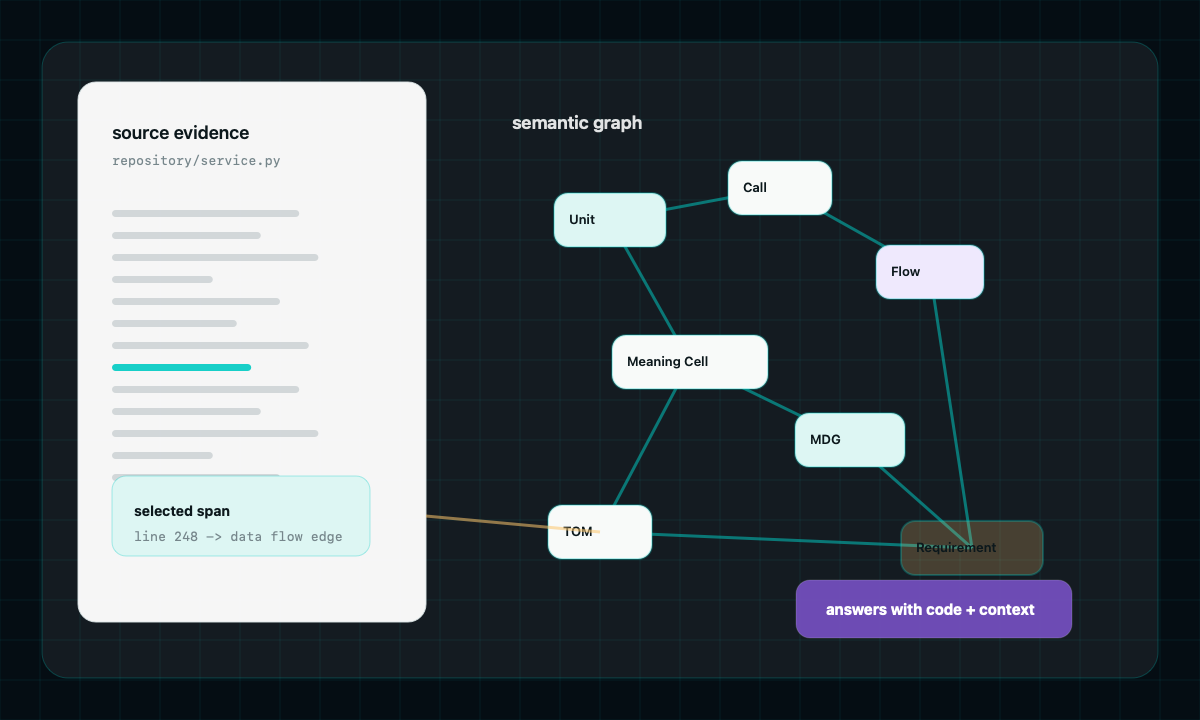
Meaning Graphs evidence view showing source code connected to UML, semantic graph nodes, and requirements

From source code to dynamic UML humans and agents can inspect.

Meaning Graphs start with the real repository and keep a chain of evidence back to source. The goal is not to hide complexity; the goal is to make the structure, intent, and flow inspectable enough that humans and agents can reason about the same system through multiple UML and graph layers.

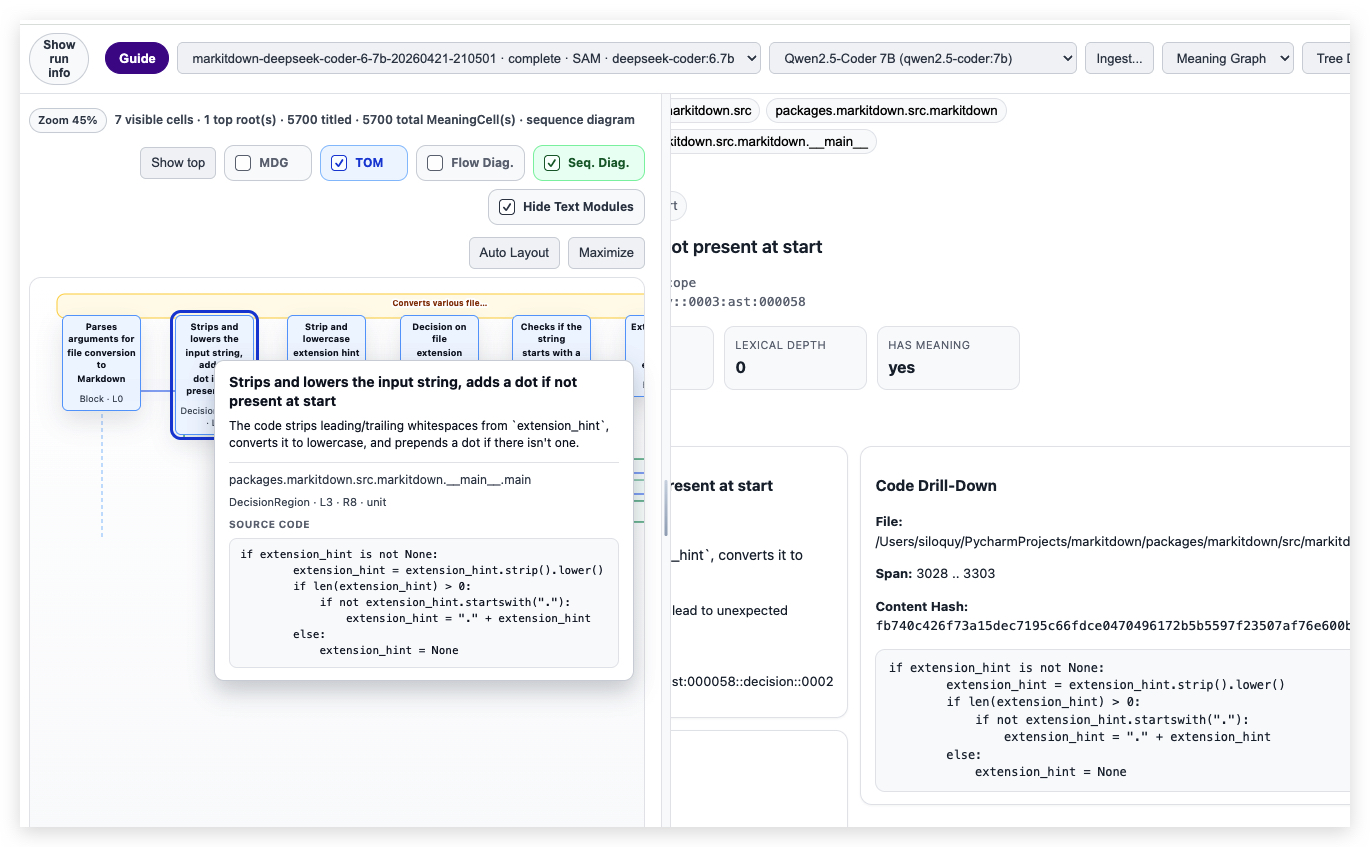
Operator manual Handle MeaningCell graph and sequence views How Flow Diag., Seq. Diag., TOM flow, context menus, and inspection work in the Meaning Graphs viewer.

Repository ingestion

Files, symbols, modules, and relations are collected as source-backed evidence, ready for generated views.

Semantic AST & SCIR

Concrete source structure is normalized into intermediate forms that can be compared, queried, and explained.

Meaning Cells

Small units of meaning become the bridge between raw code and readable architecture-level understanding.

Multi-layer UML

Generated UML views stay dynamic and navigable, from local code structures up to architecture-level system shape.

MDG & TOM flow

Trace-oriented flow connects execution, data movement, dependencies, and handover points.

Viewer evidence

The viewer keeps generated UML, diagrams, and summaries tied to source evidence, so a beautiful picture remains accountable.

Many signals, one system model.

A large codebase rarely has one simple story. Meaning Graphs let several signals exist at once: UML layers, hierarchy, flow, dependencies, semantic annotations, diagrams, and evidence. The crossings are the important part: where meaning from one signal changes what another signal means.

  • Move from a graph node to the source evidence that supports it.
  • Compare structural hierarchy with runtime or dependency flow.
  • Use dynamic UML as an interface to inspectable repository facts.
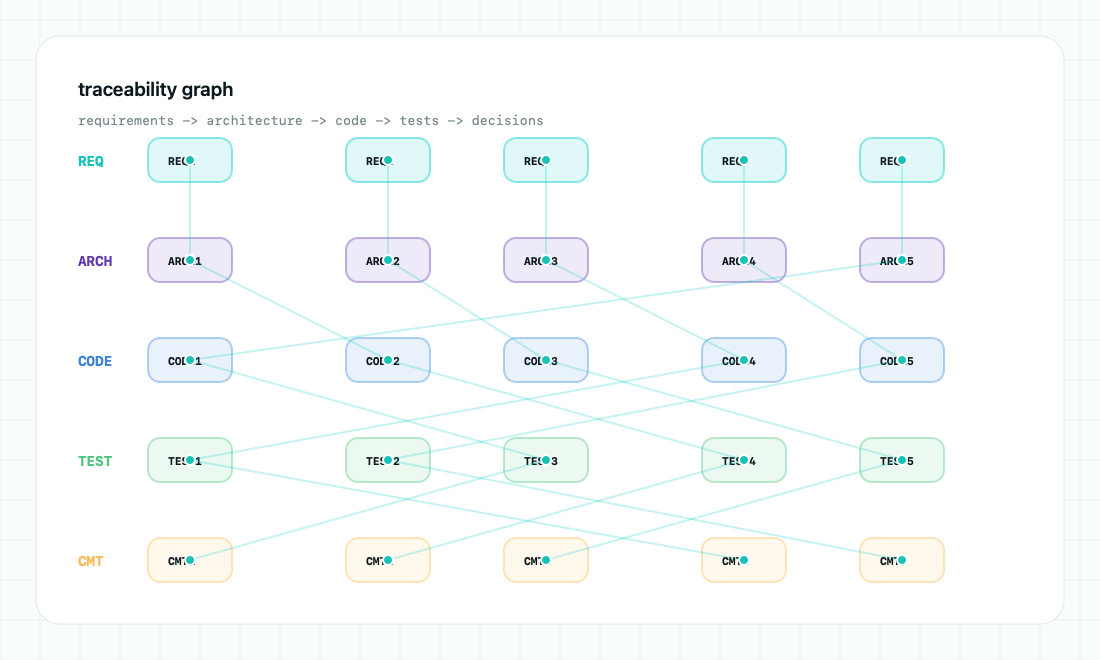
Traceability graph connecting requirements, architecture, code, tests, and comments
Requirements, architecture, code, tests, and decisions remain linked as the system changes.

Diagrams that answer back.

Generated UML and graph views should not be decorations. They should be dynamic interfaces into the repository: every box, edge, and cluster should be able to explain why it exists, what source supports it, and what work item in Portae cares about it. Soon the assistant layer can become the conversational operator for this surface: writing architecture and code through the UML interface.

Source-backedfacts before flourish
UML-awarelayers, hierarchy, flow
Agent-readyshared evidence surface
Meaning Graphs diagram view with a selected node attached to source code evidence
Generated diagrams become useful when every node can answer with source, context, and code.

The graph view that used to carry the Siloquy name.

Meaning Graphs is the public name for the graph-oriented perspective. Siloquy.com now names the whole workbench; Meaning Graphs names the part where source code becomes semantic structure, dynamic UML, flow, dependencies, and evidence that can be navigated by humans and agents.

The important distinction is that the diagrams are not drawings. They are projections over a canonical semantic model. A flow diagram, sequence diagram, dependency view, or Meaning Cell hierarchy can look different on screen, but each view must be able to answer the same question: what source, relation, requirement, or decision makes this node exist?

The graph is not a container for the code. The graph is the code made inspectable as meaning.

This is where dynamic, navigable, multi-layer UML becomes central. Large codebases are too big for one static diagram and too consequential for generic summaries. Meaning Graphs lets the user move between local source evidence, semantic units, architecture-level shape, execution flow, and future code creation without breaking the evidence chain.